Final Report
Executive Summary -PDF Download
By: Kosha Bramesfeld, Laurie Harrison and Gregory Hum
University of Toronto
April 25, 2018
Overview
The Data-Driven Design (D3) Innovation Network is a collaborative project undertaken by the University of Toronto, with participation by six instructors from various program areas who contributed to the initiative. The project team successfully targeted three high level objectives as follows:
- Build instructor capacity to access and apply learning analytics methods;
- Develop a faculty development innovation network program framework that can be replicated at other institutions or as a provincial initiative; and
- Collect and publish a set of example “small scale” methodologies or strategies that leverage access to learning analytics data.
The D3 Innovation Network faculty leads were individuals from different program areas across the University of Toronto who self-identified as having an interest in pursuing the use of descriptive data to inform course design. With the support of a network of four facilitators and local educational technologists, the faculty leads participated in a year-long program of activities to enable the design, implementation, and sharing of small-scale, course-based reflective inquiry projects. This program included four facilitated workshops, consultations with educational developers, completion of the reflective inquiry projects, and sharing of these inquiry projects in individually prepared portfolios that were also presented at a showcase event.
The D3 Innovation Network Project focused on the objectives noted above, resulting in positive outcomes for both the project coordination team and the instructors. Firstly, the project built instructor capacity for using data to inform course design, as evidenced by informal and formal feedback data on the D3 Innovation Network Project. Secondly, the faculty development innovation network program framework and resource materials are now available on the facilitators’ tool kit website. Finally, we have the initial portfolio of example “small scale” methodologies published on the Data-Driven Design Showcase Website and presented at a showcase event titled, Data-Driven Design: Habits of the Mind (March 27, 2018). In addition to participating in the network workshop series, the project leads and the instructors are engaged in ongoing knowledge mobilization activities that are expanding the work of the D3 Innovation Network initiative, including special events, workshops, conference presentations, and community round tables.
Project Activities
Faculty leads from six program areas self-identified as having an interest in examining ways to use descriptive data to inform their course design. These faculty members were supported by two facilitators from Online Learning Strategies, two facilitators from the Centre for Teaching Support and Innovation, and local Educational Technologists from their academic program area. The faculty leads participated in a year-long program of activities to enable the design, implementation, and sharing of their projects. This program included four facilitated workshops, ongoing project work, consultations with educational developers, completion of the project portfolios, and a showcase event.
Workshops
A series of group meetings was organized that focused on instructor capacity building and on strengthening network connections. The six faculty leads, up to four educational developers, and up to four Ed Tech professionals attended the workshops (as needed for each workshop):
- Workshop 1 (May 16, 2017): Initiate the D3 Network community activities
- Workshop 2 (June 22, 2017): Project planning and feedback
- Workshop 3 (November 7, 2017): Data round tables and troubleshooting
- Workshop 4 (February 28, 2018): Portfolio round tables and feedback
Reflective Inquiry Projects
Faculty leads completed small-scale, course-based reflective inquiry projects. To increase the potential impact of the online learning design practices for each instructor, the focus of the course-based reflective inquiry project was to understand how existing data sources could be used to analyze activities in progress and completed courses. The analysis, in turn, informed individual project design decisions. Faculty leads met with program consultants throughout the year-long program to discuss implementation. The planning consultation meetings focused on data identification, project design, and data analysis and interpretation.
Portfolios
Faculty leads prepared short project portfolios outlining their inquiry topics, questions, methods and data sources, analysis approach with examples, and a summary of lessons learned. The details of the projects including inquiry question, method, analysis and lessons learned were articulated using a common project profile template. Instructors had the opportunity to share and provide feedback on each others’ work. All profiles have been published in a portfolio format on the OpenUtoronto web site and shared with the broader community.
Showcase Event
On March 27, 2018, the D3 team hosted a data-driven design workshop and showcase event. All six faculty leads presented their inquiry project findings. Thirty five U of T faculty members and staff attended the event. In addition to providing an opportunity to share the work of the instructor leads, the participants also were engaged in discussions and collaborative learning tasks to set the stage for their own work using small scale data available to them in a teaching context.
Documentation and Evaluation
Through the year-long programming, the four facilitators documented workshop, resource materials and observations on effective strategies, and also solicited informal and formal feedback from the participants. In addition, the investigators collected formal feedback surveys from members of the D3 Network Team to inform future planning.
D3 Network Team
The D3 Network team included four educational developers and four educational technology specialists, as well as faculty participants.
Educational Developers
- Project Lead: Dr. Laurie Harrison, Director, Online Learning Strategies
- General oversight of the project, including faculty development programming, publication of project profiles, documentation of program format and resources, and knowledge mobilization activities.
- Project Coordinator: William Heikoop, Online Learning Coordinator, Online Learning Strategies
- Administrative support, web publishing, and events planning.
- Gregory Hum, Assistant Director, Teaching Assessment, Centre for Teaching Support and Innovation
- Consultation on design, interpretation and communication of both quantitative and qualitative analytic methodologies, and supporting project evaluation process.
- Kosha Bramesfeld: Data Analyst, Course Evaluations, Centre for Teaching Support and Innovation
- Assisting with planning and co-facilitation of innovation network meetings, consultation on instructor project goals and design, and supporting reflective inquiry and mentoring practices.
Faculty Participants
Six faculty members participated in the project. A link is provided below to the project profile of each faculty member.
- Brett Beston, University of Toronto Mississauga, Department of Psychology
- Project profile: Improving student experience and academic success
- Marie-Anne Visoi, University of Toronto St. George, Faculty of Arts & Science, Department of French
- Franco Taverna, University of Toronto St. George, Faculty of Arts & Science, Human Biology Program
- Libbie Mills, University of Toronto St. George, Faculty of Arts & Science, Department for the Study of Religion
- Project profile: Student use of video recordings for learning new material
- Sandra Merklinger, University of Toronto St. George, Faculty of Nursing
- Brenda McCabe, University of Toronto St. George, Department of Civil Engineering
Educational Technologists
Instructors invited educational technology specialists from their faculty to join the network meetings. Theses specialists also provided support with data extraction and analysis as needed.
- Simone Laughton, University of Toronto Mississauga, Head, Library & Instructional Technologies
- Neal MacInnes, Academic Information and Community Technology Supervisor, Faculty of Nursing
- Lena Kushnir, Manager, Teaching Technology Support, Faculty of Arts & Science
- Allison Van Beek, Instructional Technology Specialist, Engineering
Building Instructor Capacity
The D3 network was intended as an entry-level professional development program designed to provide a model for scaffolding and for providing support for faculty who were interested in using descriptive data to inform course design. Participants included faculty from different disciplines, which increased the chances of diverse idea exchange and the opportunity to demonstrate the utility of data-driven design across disciplines. The D3 network utilized a peer-to-peer supported network model for idea exchange and peer support.
The D3 reflective inquiry projects were rooted in the Centre for Teaching Support and Innovation’s larger framework of inquiry on teaching and learning as depicted in Figure 1. The D3 projects intended to engage faculty members in purposeful reflective teaching and in developing habits of mind that would facilitate their thinking about data-driven design efforts within a larger framework of scholarly teaching.
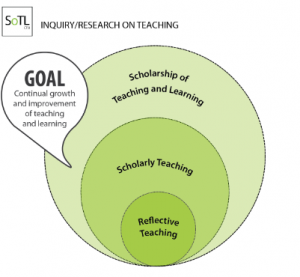
Figure 1. CTSI’s Model of inquiry on teaching and learning.
Focus on Using Small-Scale Methodologies
Faculty leads were encouraged to use small-scale methodologies to identify data that they had already collected, had access to, could easily collect, or could easily gain access to within their regular teaching and learning contexts. We referred to these data sources as “pocket analytics.” Workshops and consultations focused on helping faculty leads reflect on how these small-scale methodologies and pocket analytics could be used to support course design improvement. Faculty leads additionally prepared individual portfolios designed to help them reflect on how the data could be used to inform changes to their courses and to document course improvement in career dossiers for use in promotion, tenure, review, and recognition.
Pocket Analytic Examples
- All User Activity
- Example from Dr. Visoi, Department of French
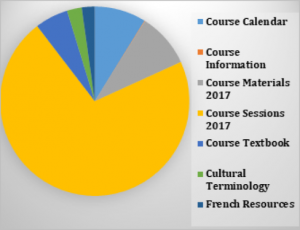
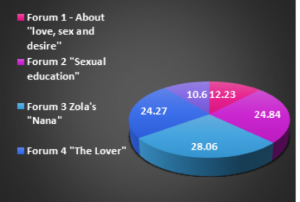
- User Activity Related to Specific Course Content
- Example from Dr. Visoi, Department of French French
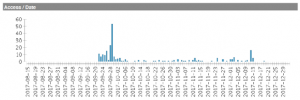
- User Activity Over Time
- Example from Dr. Mills, Department of the Study of Religion
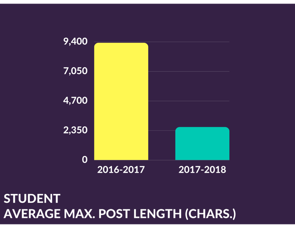
- Average discussion board post length
- Example from Dr. Merklinger, Faculty of Nursing
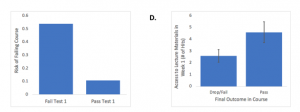
- Course grades:
- Example from Dr. Beston, Department of Psychology)
Other examples of small-scale data forms included course evaluation data, student feedback data (surveys), marks on a grading rubric, and qualitative analysis of student assignments.
Replicable Program Framework
In order to support future faculty development initiatives, a key output of this project is a comprehensive facilitators’ toolkit with resources available for download at http://www.ocw.utoronto.ca/data-driven-design-network/tool-kit/. This website contains documentation and resource materials to reproduce this faculty development programming in other program areas or at partner institutions. The Program Overview and Facilitators’ Guide includes short descriptions for each of the four main workshops which outline the main components in each step of the process. The rest of the material is organized in folders according to each workshop and includes facilitators’ overview, presentation materials, handouts and worksheets for each of the four workshops, as well as a facilitator’s slide presentations, templates, handout, and worksheet for final community sharing workshop event. All material in the Facilitator’s Toolkit is available under a cc-by licence and can be used or adapted to meet local needs.
Evaluation of Impact
The project team designed an online survey (Appendix A) to collect feedback from faculty leads, facilitators, and support staff regarding their experience participating in the project, faculty perception of the impact of the D3 project on their teaching, faculty’s likeliness of future involvement in similar projects, and the impact of the project on their approach to inquiry and course design. While survey items were geared toward faculty experience, facilitators and support staff could also provide their feedback and their recommendations for future work in the open response survey questions. The survey included four sections with likert-scale questions and seven open response questions. Survey responses were anonymously collected and completing the survey was on a voluntary basis. All six faculty leads and two support staff completed the survey. Below, we summarize the results in three sections: faculty response to likert-scale questions, faculty response to open response questions, and staff response
Feedback Response to Likert-Scale Questions
Faculty leads were overall satisfied with their experience in the project as evident from their overall satisfaction with each component of the project. All six faculty leads were extremely/very satisfied with consultations. As for D3 network meetings and the showcase, five faculty leads expressed that they were extremely/very satisfied with these two components.
Another question probed faculty leads’ perception of the helpfulness of each project component to support learning and development in the D3 project. All six faculty leads agreed that consultations supported their learning a great deal/mostly. Network meetings provided a great deal/mostly support for five faculty leads while the other faculty indicated the meetings to have somewhat supported their learning and development.
As shown in table 1, at least five out of six faculty members strongly-agreed/agreed that the D3 project informed their course design and increased confidence in using data. As for continued use of data in course design and teaching, four out of six faculty members chose strongly-agree/agree while the two other faculty members were unsure about future use as they selected the Neutral/NA option. All six faculty leads planned to share their projects informally and four out of six had already developed plans to disseminate their findings more formally. The program was deemed “productive use of faculty time” by all six respondents, who also indicated that they would recommend the program to others faculty members.
Table 1.
Faculty leads overall experience and perceived future impact of the D3 network project.
| Item | Strongly agree/Agree | Neutral/NA |
| D3 has informed the design of the course I worked with on in this project | 5 | 1 |
| I plan to share the results of this project more widely in an informal setting (e.g., with colleagues) | 6 | 0 |
| I plan to share the results of this project more widely in a formal setting (e.g., in presentations, conferences, publications) | 4 | 2 |
| I plan to continue using data to inform teaching | 4 | 2 |
| D3 has increased my confidence in using data to inform teaching | 6 | 0 |
| The D3 program was a productive use of my time | 6 | 0 |
| I would participate in future programming similar to the D3 program | 5 | 1 |
| I would recommend other faculty/staff participate in future programming similar to the D3 program | 6 | 0 |
| I have developed new and/or ongoing relationships in this project with faculty and/or staff | 4 | 2 |
In this project, faculty leads engaged in the design, implementation, and sharing of small-scale, course-based reflective inquiry projects. This process involved several distinct steps and the D3 network team provided support and consultation to build faculty capacity in each of the steps. One question in the survey probed faculty members’ perception of the effectiveness of the D3 network project to address and support each step of the inquiry process. As shown in Table 2, the faculty leads found the D3 project particularly helpful at helping them to formulate inquiry questions to inform course design, collect and interpret data, and apply findings to inform their course design.
Written comments for the open-response questions, suggest that the D3 project helped the faculty leads appreciate the value of using data to inform course design and expressed relief at the ease by which this data could be acquired.
Table 2.
Faculty leads perception of the effectiveness of D3 program to support each step of the inquiry process
| Item | Strongly agree/Agree | Neutral/ NA |
| Formulate inquiry questions to inform course design | 6 | 0 |
| Identify LME (e.g., Portal) data to inform course design | 3 | 3 |
| Identify additional data (other than LME data) to inform course design | 5 | 1 |
| Collect data that can inform course design* | 4 | 2 |
| Analyse data to inform course design* | 4 | 2 |
| Interpret data to inform course design* | 5 | 1 |
| Apply findings to inform course design* | 5 | 1 |
Note: * Includes both historic data sources and strategies for future inquiry.
Faculty feedback: Open response questions.
Overall satisfaction with D3 network project activities and the inquiry projects were also reflected in faculty leads’ answers to open-response questions. As an example one faculty lead stated: “It was a great experience and I look forward to pursuing my inquiry topic further and presenting it to my own faculty. Thank you!” The project seemed to have been practical and efficient in facilitating faculty members’ efforts to locate and use available data to inform their course design. Specifically, the D3 project provided clear and easy to access instructions for each step of the inquiry process. One faculty member explained: “This was a great opportunity to explore methods to improve online workload for both students and myself. Without the project it is almost certain I wouldn’t have undertaken anything so concrete. The sessions with support staff were incredibly helpful in terms of honing down the question and approach to data retrieval.”
Accessing data and interpreting collected data to inform course design were identified as challenging dimensions of the project that were effectively supported by D3 network project team. One instructor appreciated how the project team led discussed the design and implementation of student surveys: “One outcome that was discussed was addressing perceived/actual workload using a student survey. Suggestions for how this might be generated and deployed by D3 support staff were useful in this regard.”
We also asked the instructors to indicate how the D3 network components and activities be further improved and suggest additional support that could be designed in the future. There was request for more time to be allocated to discussing project findings. One faculty member suggested: “subsequent runs could include a brief video interview with a couple of past participant, describing how it went for them.” More discussion on study design, experimental design in particular, and on data analysis, was also suggested.
One important goal articulated in the D3 proposal to eCampus Ontario was to determine the scalability of the D3 program in terms of more participants and adoption by other units and institutions. We asked faculty members to reflect on the scalability aspect of the project based on their experience participating in D3 network project. Responses showed that faculty leads supported the expansion of the project to be available to other interested faculty members. However, the high ratio of support staff to faculty leads was highlighted as a desired aspect of the first iteration of the D3 project: “Should certainly be available to others. But running it in small groups is pretty important, I think. Too large a group and you lose the thread of each other and each others’ projects; The feeling that the support team was about the same size as the participant team was pretty amazing.”
Support Staff Observations and Survey Feedback
Staff involved in support and consultation noted that identifying LME affordances available to support data-driven course design was very helpful and that such information could be used to help other instructors. As well, sharing ideas about data sources that can be used to help inform instruction was considered an important benefit. Support of these efforts through online resources, project meetings, and collegial consultations were appreciated. As one project support staff member recounted: “The D3 program provided me with an opportunity to work with a faculty member and to learn more about the use of data to inform course design. I also appreciated the opportunity to learn more from colleagues who are working on similar projects.”
Support staff suggested additional resources on applied research related to learning analytics and data-source integration could be helpful. Establishing collaborations with other network groups such U of T’s SoTL network or external groups such as Educause Leading Academic Transformation could be lead to furthering data-driven design initiatives. Another suggestion was to strengthen the connections between U of T library data research initiatives and U of T research offices. It was recommended that resources and guidelines related to accessing and using course data be made available more broadly and integrated into general instructor help resource web site structures. As a final component of evaluation, we reviewed responses of participants after the showcase event, as attendees were emailed and asked to complete an online evaluation of the event. Participants particularly liked the showcase presentations and enjoyed learning about the different projects.
Knowledge Mobilization Activities
In addition to participating in the network workshop series, project leads and instructors are engaged in ongoing knowledge mobilization activities that are expanding the work of the D3 Innovation Network initiative. These include special events, workshops, conference presentations and community round tables. The project website offers a summary of activities, as well as this final report and the full Facilitators Toolkit, available for download and adaptation under a CC-BY licence. A summary of dissemination activities is provided here.
Dissemination Channel Summary
D3 Network Project Showcase: Workshop and Website
- Data-Driven Design: Habits of the Mind Workshop: March 27th, 2018, 9:15 am – 11:30 am: http://teaching.utoronto.ca/event/d3-habits-mind/ (35 attendees)
- University of Toronto, Open UToronto, Data-Driven Design Showcase Website: http://www.ocw.utoronto.ca/data-driven-design-network/showcase/
Planned Sharing of Faculty Inquiry Projects
- Present as part of the FSG program, Robert Gillespie Academic Skills Centre
- Faculty sharing at the Lawrence S. Bloomberg Faculty of Nursing
- Participate in University of Toronto Teaching and Learning Symposium
- Presentations in the Department of French (administrators and course instructors)
- Workshop presentation for Teaching Assistants during orientation week
- Plans to publish in “Blended and Online Teaching in the Humanities: Pedagogical Tools for Designing and Implementing French Language and Cultural Studies Courses”, book accepted for publication by Cambridge Scholars Press
Other
- U of T Online Learning listserv (130 subscribers)
- Share project updates via Ontario University Council on eLearning (OUCeL) listserv (100 subscribers)
- U of T Online Learning Strategies Blog – pending
- Learning Analytics Summit (April 12th, 2018), Bloomington, Indiana
- Networking with U of T Business Intelligence group to inform institutional student data use planning with regard to instructor access to data to inform teaching design.
Next Steps
Future iterations of the project can focus on providing additional supports, especially in relation to accessing LME data. At least one faculty lead and several showcase attendees also reported wanting more time for peer-to-peer discussion and Q&A at the showcase event. Discussions are ongoing with the Centre for Teaching Support & Innovation at the University of Toronto, who are acting in both liaison and advisory capacity with regard to the possible continuation of this project. A scalable peer-based mentoring program is envisioned, with guidance from the Scholarship of Teaching and Learning network. This has the potential to provide a sustainable future for the project.
For more information on the Data-Driven Design (D3) Innovation Network Project, please contact online.learning@utoronto.ca.
Data-Driven Design (D3) Innovation Network Project Report by Online Learning Strategies Portfolio is licensed under a Creative Commons Attribution 4.0 International License.
This project was supported by an Innovation Grant from eCampusOntario.