Pocket Analytics: Reading Course Reports
Instructors may access online course data to improve interaction within the course and monitor student behaviour and performance in a semester. Using course dashboard data, or “pocket analytics” instructors can potentially address student problems and potential issues before they impact learning and performance. An early check and weekly monitoring can identify problems with course design, or problematic patterns of behaviour among students. Examples below are from the Blackboard Learning Management System (LMS).
CAVEAT
With these LMS course reports provided by the you can find out how often and when students visited the site and accessed content areas and get statistics on overall usage of the course. However, the reporting tools cannot prove that the student was actually interacting with the material at the time/for the time that they were logged in.
HOW? In Blackboard these report options are found in the Control Panel under the “Evaluation” tab.
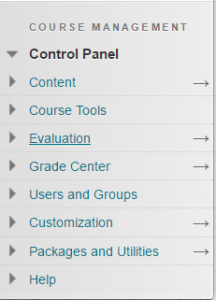
In the Evaluation tab select “Course Reports”
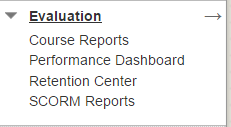
Report options include:
1) All User Activity Inside Content Areas: This report displays a summary of all user activity inside Content Areas for the course. Use this report to determine which students are active in your course and which content areas they are using.
When a student opens a content folder, all content that resides inside this folder (files, links, video) will be considered “accessed” by the student whether or not they have opened a link or watched a video.
All User Activity inside Content Areas report should open in a new window.
- It starts with a pie chart and table showing the number and percent of the times someone accessed the different content areas in the site.
- The next part is a series of tables that show each student and how many time he or she has clicked to open a folder/visit various content areas. Note that you may have multiple tables if the rows with student names is longer than one screen or if there are more columns of content areas that fit on the screen.
- After the first set of tables, you will see another table that summarizes access by date. It shows the number of total times students visited for each day in the period you specified.
- This is followed by another set of tables that show how many times students visited content per student by days. These tables are organized by month, so if you chose dates over multiple months, you will see multiple tables. Each table includes a column with a total, but note that is a total for that month. There is no summary of overall total visits by students for the time period you selected.
For an example of what this looks like open this pdf of a sample report. This small sample is a report run on two users during the week of January 30 – February 03, 2017.
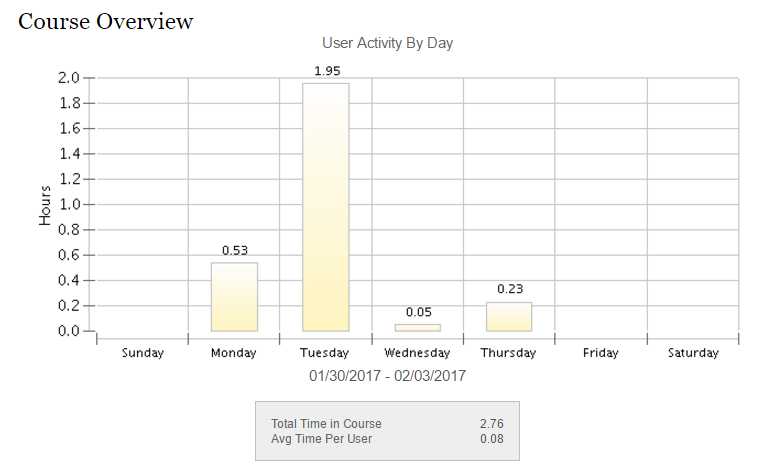
2) Course Activity Overview: This report displays overall activity within your course, sorted by student and date. Data includes the total and average time spent per user and the total amount of activity the user had in the course. You can also click an individual student’s name to access their Student Overview for Single Course report. This report can help you determine which days of the week students are active in your course and see how much time overall students spend.
On the Course Activity Overview report
- You will see a graph with User Activity by Day showing the days of the week that students accessed the site.
- It then shows the Student Overview, which is a graph with a blue horizontal bar beside each student’s name that shows the number of hours the student accessed the site.
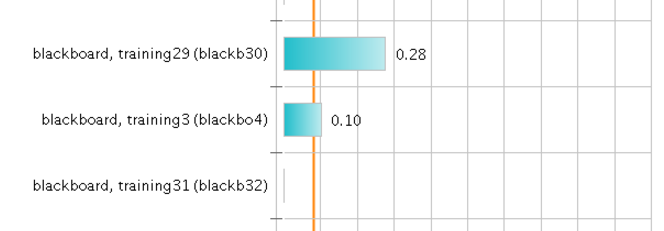
- This may be all the information you need to confirm which students were in the site on a specific date or date range. If you want to see information about a specific student (e.g. blackboard, training3 above), you can click on the blue bar beside the name of the student to run a report about just that student.
3) Course Performance: This displays how a single course performs against a selected set of goals.
4) Overall Summary of User Activity: This displays user activity for all areas of the course, as well as activity dates, times and days of the week. Use this report to view student access as well as how often Course Tools are being used.
For an example of what this looks like open this overall summary of user activity report. This small sample is a report run on two users during the week of January 30 – February 03, 2017.
5) Single Course User Participation Report: This displays detailed statistics on assessment and collaboration tool submissions for all users in this course during a specified time frame.
6) Student Overview for Single Course: This displays an individual student’s activity within your course, sorted by date. Data includes the total overall time the student spent in the course as well as detailed information about the student’s activity, such as which items and Content Areas the student accessed and the time spent on each. Use this report to check a particular student’s course activity.
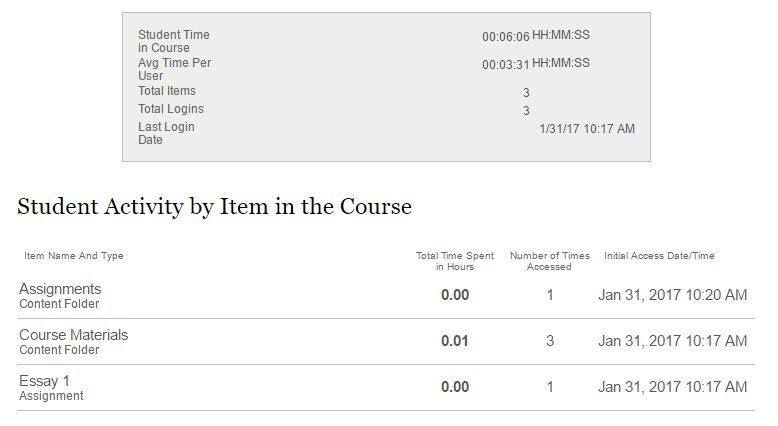
On the Student Overview for Single Course report
- You will see the User Activity by Day graph for the individual student. It shows the days of the week that this student accessed the site. If the time period you selected is restricted to one week, this might be useful.
- It then shows the Student Activity by Item in the Course, which actually can be very useful.
- Note that it gives the Initial Access Date/Time and not the most recent access information.
- It also shows the Total Time Spent in Hours and the Number of Times Accessed on different items.
- Remember that this information cannot prove that the student was actually interacting with the material at the time he or she was logged in or was in a particular area. What it may be able to show is that a student was NOT in a particular area of the class site during the time you specified.
This information is similar to the single student report you can get from the course activity overview (above). For an example of what this looks like open the student overview report.
7) User Activity in Forums: This displays a summary of user activity in Discussion Board Forums in the course. You can see which forums are used the most.
8) User Activity in Groups: This report displays a summary of user activity in Groups for the course. You can see if students are active in their groups.
How to Read Course Reports
Reports are divided into sections and include charts as well as raw data. The sections vary depending on what type of report you ran. Note that generating a report in Excel format does not provide you with charts.
For example, the Overall Summary of User Activity report’s first section displays the number and percentage of hits to each course area or tool, followed by a breakdown of hits by user. You can consult this section to see which tools have had limited access. The next sections contain bar graphs displaying the users’ access during the specified date range, followed by a breakdown of hits by users. These sections show trends in course access and specific dates a user accessed the course.
Retention Center
The Retention Center provides an easy way for you to discover which students in your course are at risk. Based on preconfigured rules and rules you create, students’ engagement and participation are visually displayed, quickly alerting you to potential risk. From the Retention Center, you can communicate with struggling students and help them take immediate action for improvement.
References
https://en-us.help.blackboard.com/Learn/Instructor/Performance/Course_Reports
https://bbhelp.cit.cornell.edu/reports/
https://sites.google.com/site/helpdeskclasssites/reports